
CERC — Environmental Software and Services
- Overview
- Air pollution modelling
- ADMS 6
- ADMS-Roads (Extra)
- ADMS-Urban
- MAQS
- ADMS-Airport
- ADMS-Screen
- Feature comparison
- Emissions management
- EMIT
- Wind energy and airflow
- FLOWSTAR-Energy
- Accidental releases
- GASTAR
- LSMS
- ADMS-Puff
- ADMS-STAR
- Managing model runs
- Run Manager
- Model evaluation
- Model Evaluation Toolkit
- Meteorological data processing
- WRFtoMet
- Related Documentation
- User guides
- Technical specifications
- Model validation
- Newsletters
- Publications
- CERC co-author publications
- CERC software publications
- Presentations
- Other information
- Traffic emissions
- Prices
- Free demo
- Visualisation tools
- Current software versions
- System requirements
Visualisation tools
Most output of the model is in the form of ASCII text, which can be imported into most visualisation packages. For the packages below however, we have programmed automatic links to the ADMS software, so that there is a seamless, integrated flow of data.
While ADMS 6, ADMS-Urban, ADMS-Roads and ADMS-Airport are packaged with the Mapper, a built-in input and output data visualisation tool, all ADMS modelling software has been designed to work with the third party visualisation tool Surfer. This is important for analysis of the model output and for helping with the management of pollution sources and emission inventories. Each visualisation tool is described below.
If you have a particular visualisation package that you would like to use with ADMS data, we may be able to help. CERC staff have worked with a variety of GIS and visualisation tools, and can give guidance on how best to use these.
* These applications should all be obtained from the suppliers.
Mapper[top]
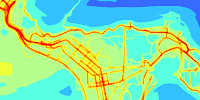
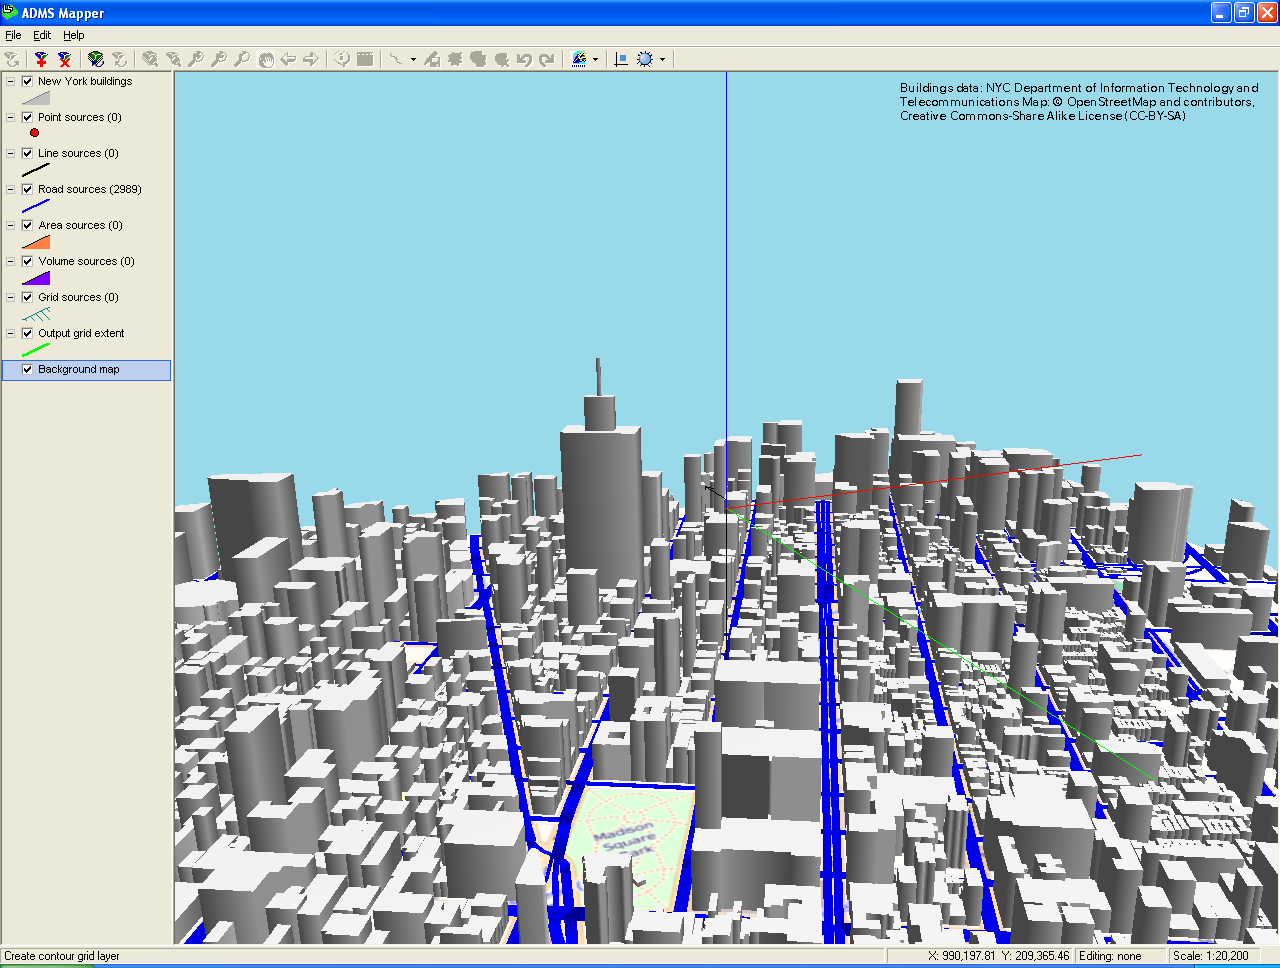
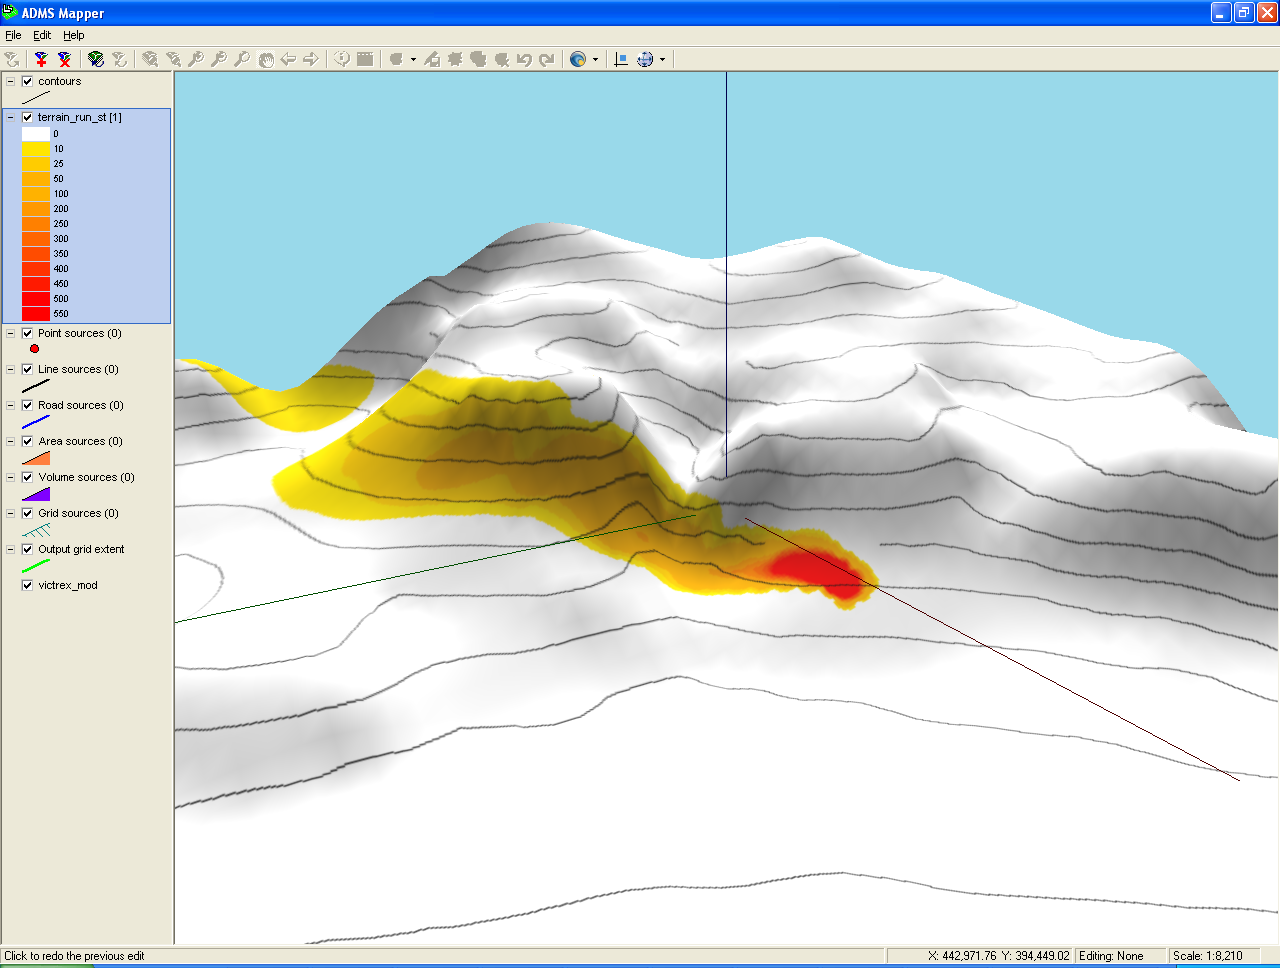
The Mapper is supplied with ADMS 6, ADMS-Urban, ADMS-Roads, ADMS-Airport and FLOWSTAR-Energy as a visualisation and editing tool. It allows comprehensive management of input data and can be used to visualise output concentrations.
The Mapper allows ADMS items to be created, edited and displayed graphically, background maps can also be added to the Mapper view. More information about the Mapper can be found in:
- the Mapper user guide,
- a presentation from the ADMS-Urban and Roads 2013 user group meeting detailing the use of the Mapper,
available from the User guides and Presentations page.

(Click to enlarge)
(Click to enlarge)
(Click to enlarge)
Surfer*[top]
Surfer is a Golden Software package that can be used to create colour contour plots of output such as concentration and deposition, 3D surface plots of terrain and vectors plots of wind velocity. Contours can be overlaid on digital base maps.

Surfer is a grid-based contouring and three dimensional surface plotting graphics program. It interpolates regular or irregularly-spaced XYZ data onto a grid, and then uses this to produce contour maps and surface plots. Surfer can also be used in combination with ArcGIS to produce plots overlaid on digital base maps.
CERC has developed a utility which facilitates the plotting of ADMS output data in Surfer, and can provide help in generating a wide variety of output. This is provided free with ADMS models and FLOWSTAR-Energy—please contact us for further details.
For more information on Surfer, please visit the Golden Software website.