
CERC — Environmental Software and Services

- Overview
- Net Zero and climate change
- Industrial permitting and planning
- Low Emission Zones and Low Traffic Neighbourhoods
- Air Quality Management
- Planning and development control
- Hazardous releases
- Odours
- Wind energy and airflow
- Urban environment and climate change
- Emissions inventories and emissions verification/ optimisation
- Model evaluation
- Aviation and air quality
Low Emission Zones and Low Traffic Neighbourhoods
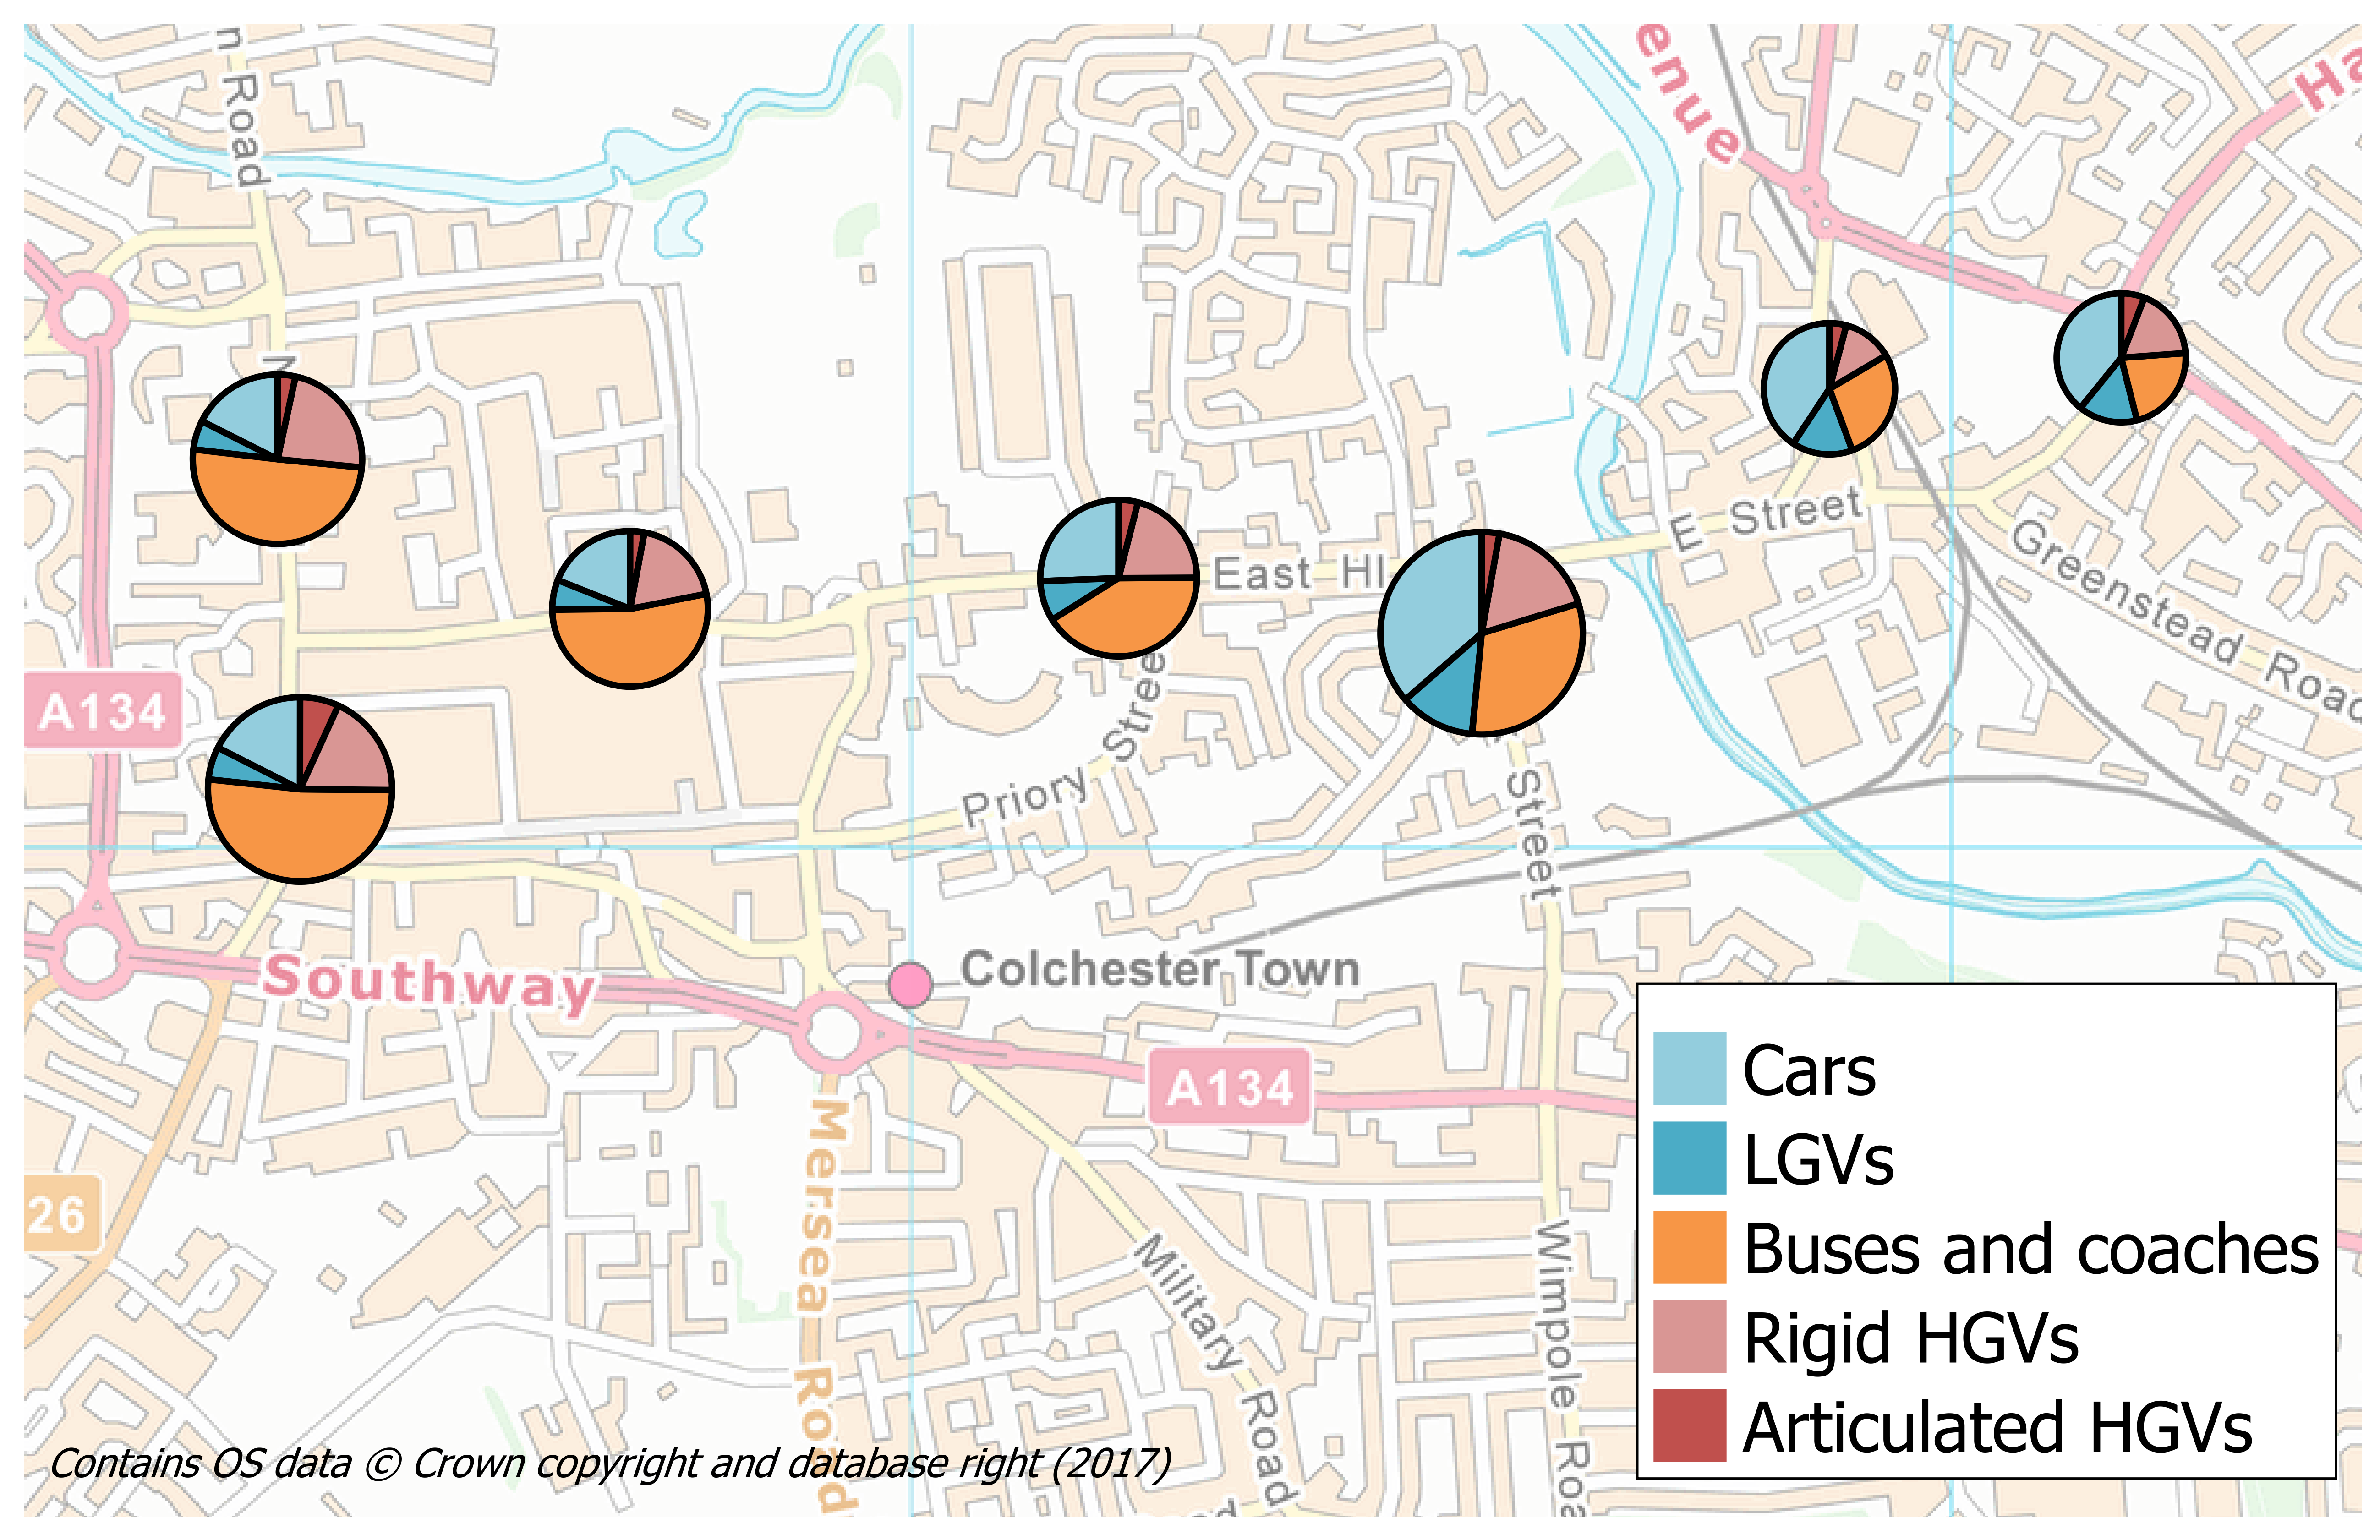
Map 1: NOx concentration source apportionment
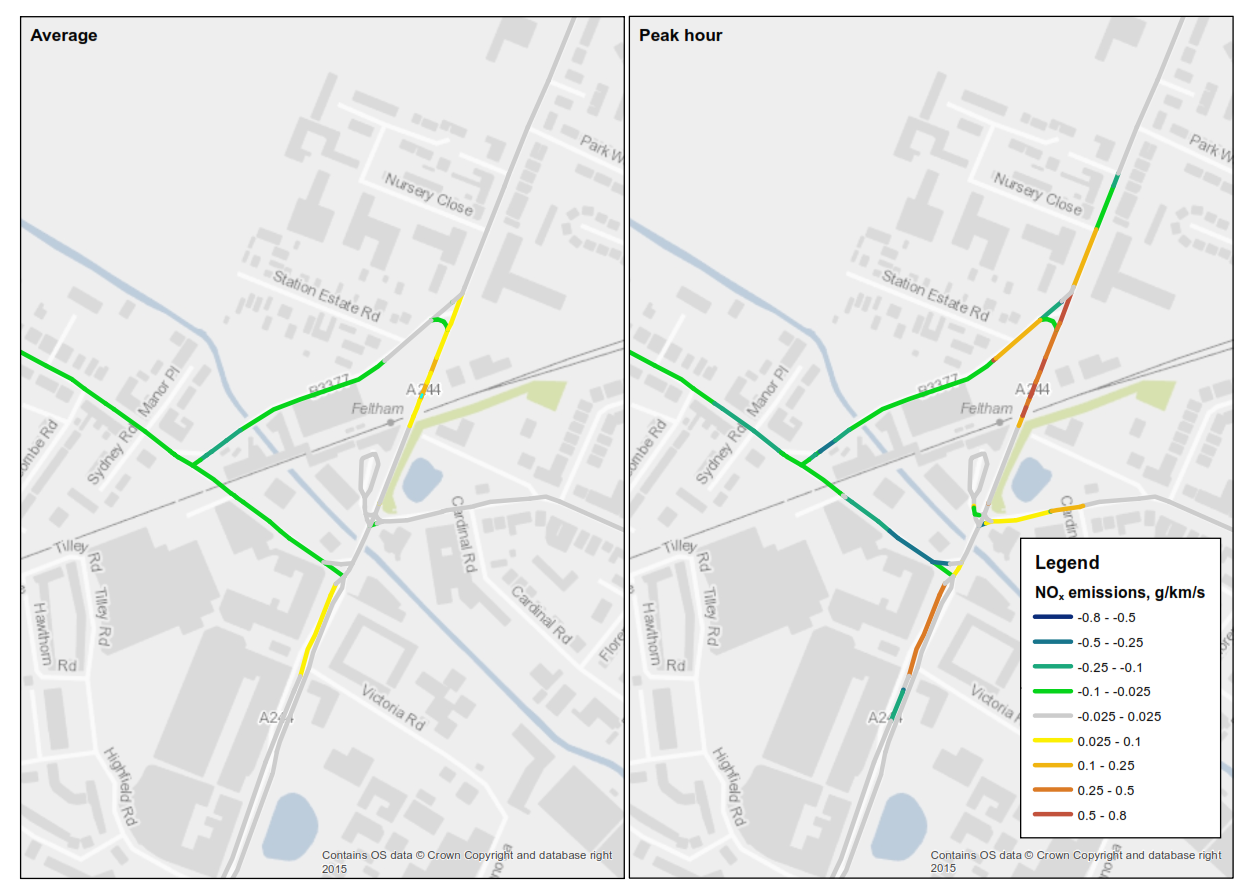
Map 2: Changes in NOx emissions, g/km/s
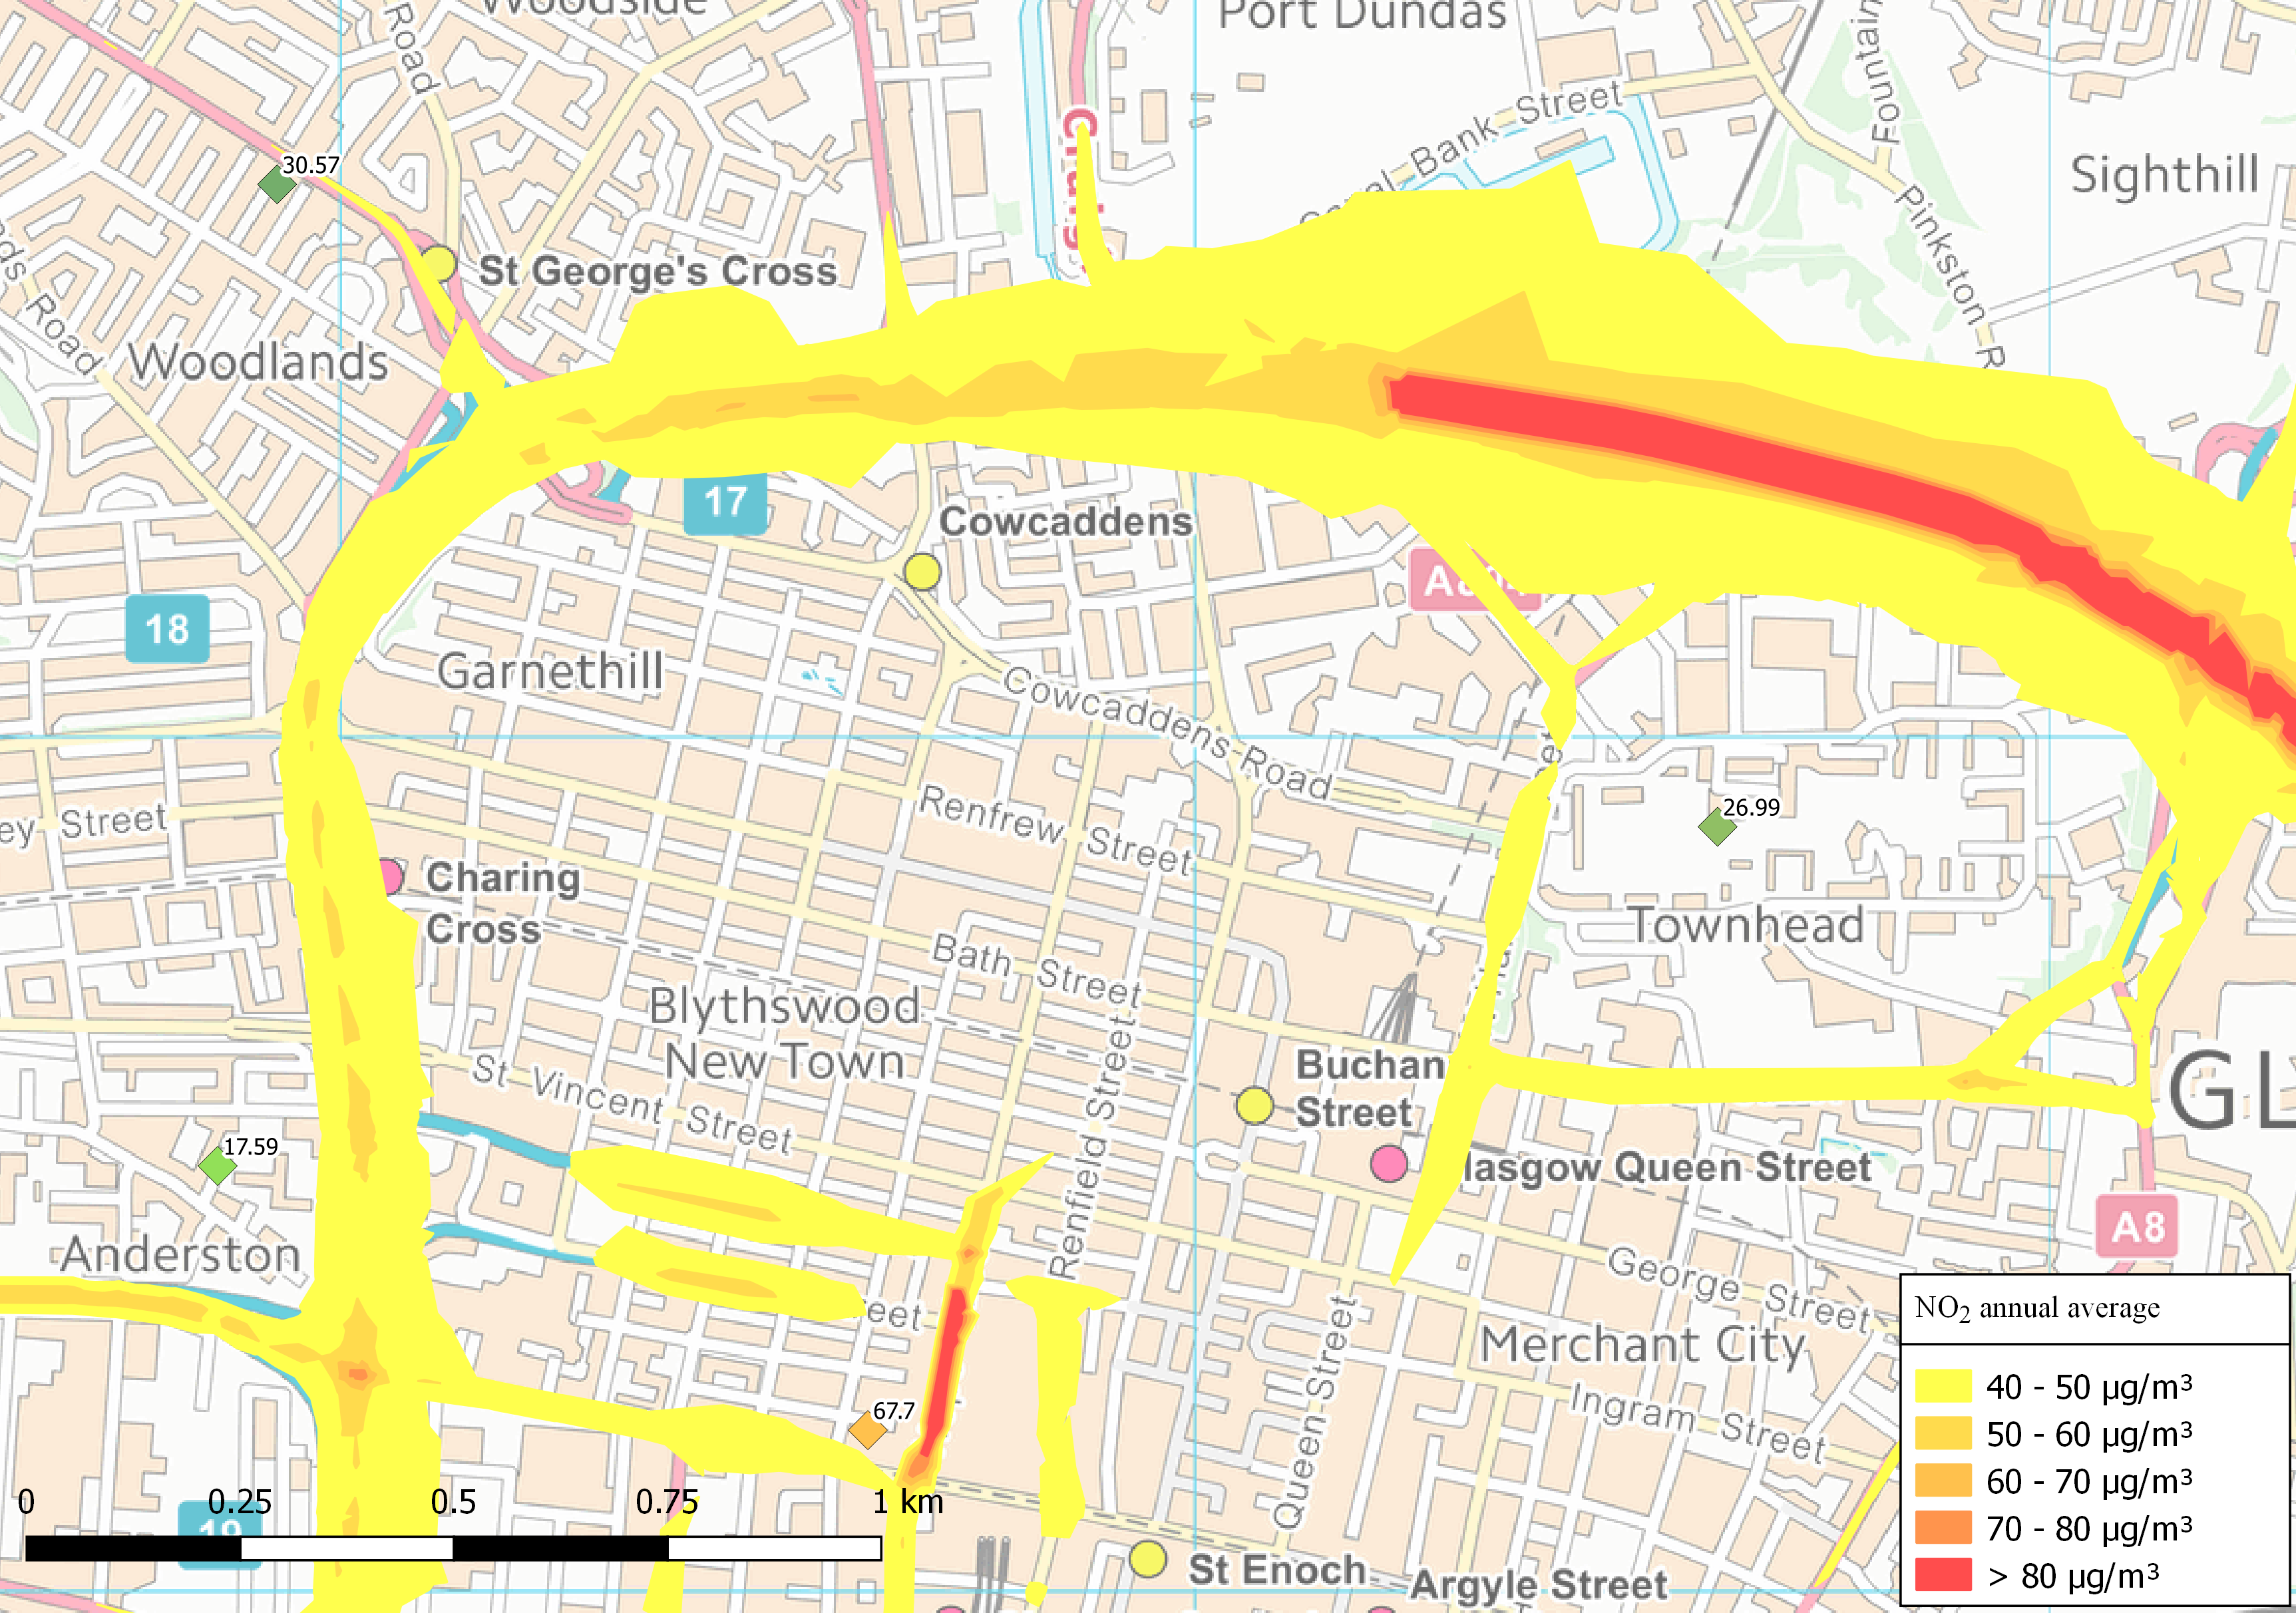
Map 3: Annual average NO2 exceedences
CERC's consultancy team has been assisting UK local authorities with their Air Quality Management responsibilities since 1995. We have extensive experience in the assessment of air quality measures on challenging timescales.
We use our ADMS-Urban and EMIT software and apply a range of techniques for robust assessment, such as:
- Source apportionment of emissions and concentrations, for instance to determine the relative contributions from diesel cars below Euro 6 standard. Map 1, from a recent assessment, shows the proportion of total NOx concentration due to particular vehicle types at specific locations.
- Assessment of the impact of measures, including changes in emissions and concentrations due to changes in road traffic flows and fleet composition. Map 2 shows the changes in emissions predicted from the implementation of a mitigation measure.
- Contour plots from detailed modelling. Map 3 shows the areas predicted to exceed the NO2 annual average limit for central Glasgow.
- Determination of impact descriptors. Map 4 shows a difference plot of annual average NO2 concentrations for a proposed Streetscape scheme in Dulwich, coloured by:
- significance criteria from Environmental Protection UK (EPUK) and Institute of Air Quality Management (IAQM) guidance for Land-Use Planning and Development Control (version 1.2, January 2017); and
- impact descriptors for the change in concentrations at building facades across the scheme area, as defined in the same guidance.
- Health impacts of air pollution. For some schemes, we have included:
- air pollution mortality burdens, based on modelled pollution concentrations; and
- damage cost appraisals, based on change in emissions.
We provide these outputs on different scales to enable further analysis against health, social and economic data. For example, Map 5 shows an emissions inventory of West Yorkshire non-road PM2.5 emissions by Lowest layer Super Output Area (LSOA); these are statistical geographical areas used for Census datasets and other indicators held by local authorities.
For more information, please contact CERC and one of our expert consultants will be pleased to assist you.
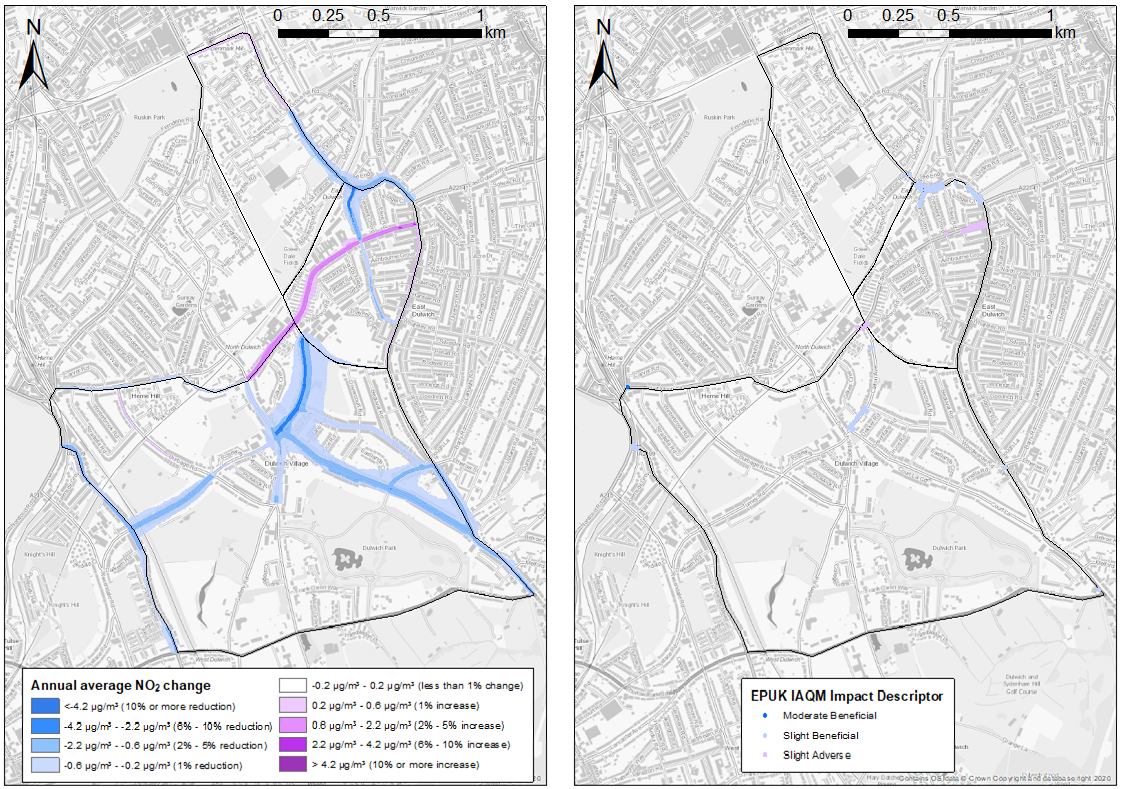
Map 4: EPUK / IAQM significance assessment for annual average NO2 concentrations
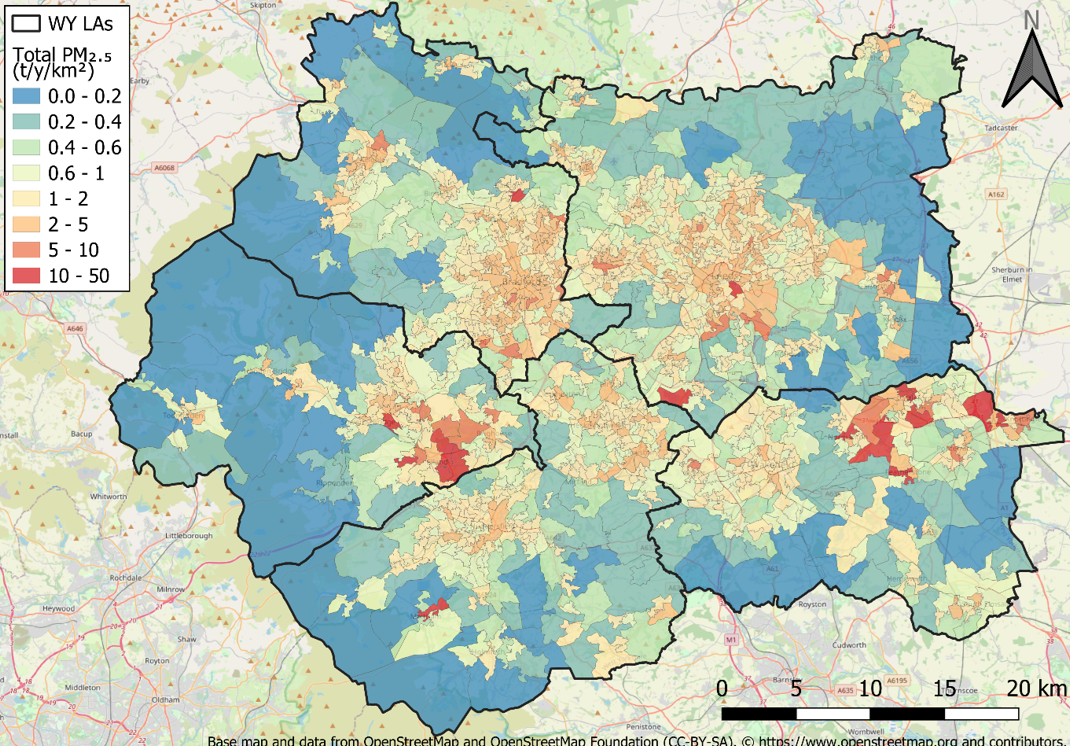
Map 5: Emissions inventory of West Yorkshire non-road PM2.5 emissions by Lower layer Super Output Areas (LSOAs)